Data at Your Fingertips
The Office of Institutional Research and Effectiveness (IRE) presents institutional data in accessible and meaningful ways and provides prompt, accurate responses to all requests for information. We are committed to maintaining high standards of data integrity and security at all times.
University Data
Student body enrollment data:
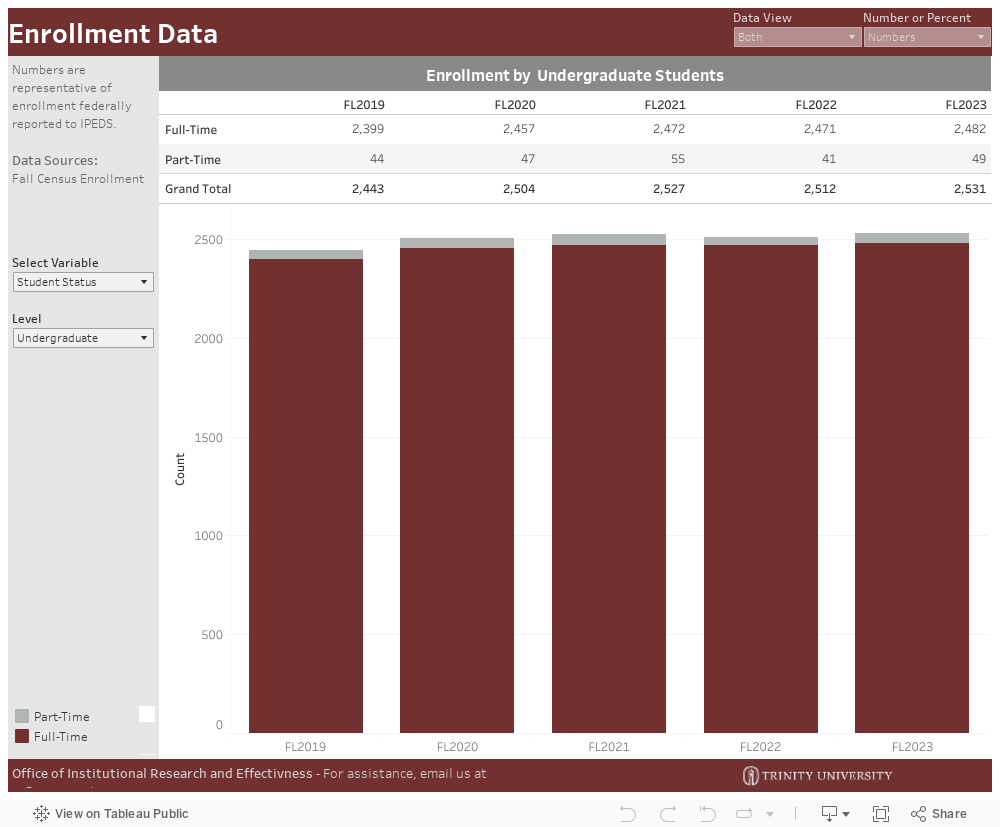
New Full Time First-Year Degree Seeking Students
Total: 659
Percentage Male: 45%
Percentage Underrepresented: 50%
Average SAT Score: 1398
Average ACT Score: 31.4
Percentage Federal Pell Grant Recipients: 19%
This information can also be found in our Common Data Sets and Factbooks.
Factbooks
The Trinity University Factbook provides statistical institutional information.
Common Data Sets
The Common Data Set (CDS) initiative is a collaborative effort among data providers in the higher education community and publishers as represented by the College Board, Peterson’s, and U.S. News & World Report. CDS reports display standardized Trinity statistics for year over year comparisons.
External Data Sources
- Integrated Postsecondary Education System (IPEDS)
The IPEDS is a system of surveys designed to collect data from all primary providers of postsecondary education.
- National Center for Education Statistics (NCES)
NCES is the primary federal entity for collecting and analyzing data related to education in the U.S. and other nations.
- The Chronicle of Higher Education
The Chronicle is an academic source of news information. You can receive free access by registering for an account.
- Higher Education Data Sharing (HEDS)
This consortium of 129 private liberal arts institutions shares data in a collaborative manner for the betterment of its members.
- US News and World Report
The US News and World Report publication produces an annual “College Rankings” list widely consulted by prospective students.
Student Achievement and Success
Retention Rate
Trinity's Office of Institutional Research and Effectiveness has identified acceptable, preferred, and ideal retention rates. Using data from reference institutions, retention rates are regressed on institutional characteristics. The resulting model is used to predict retention rates at Trinity based on the characteristics of each incoming cohort and characteristics of Trinity in the year each cohort started. The resulting prediction is Trinity's preferred retention rate. The ideal and acceptable retention rates are the upper and lower limits of the 95% prediction interval around each predicted retention rate.
For the last five years, Trinity’s retention rate from first to second year has exceeded the preferred retention rate by 2-3 percentage points, ranging from 89% to 93% with an average of 91%. Among first-time bachelor’s degree-seeking students who started at Trinity in 2022, 92% were retained to the second year (see Figure 1).
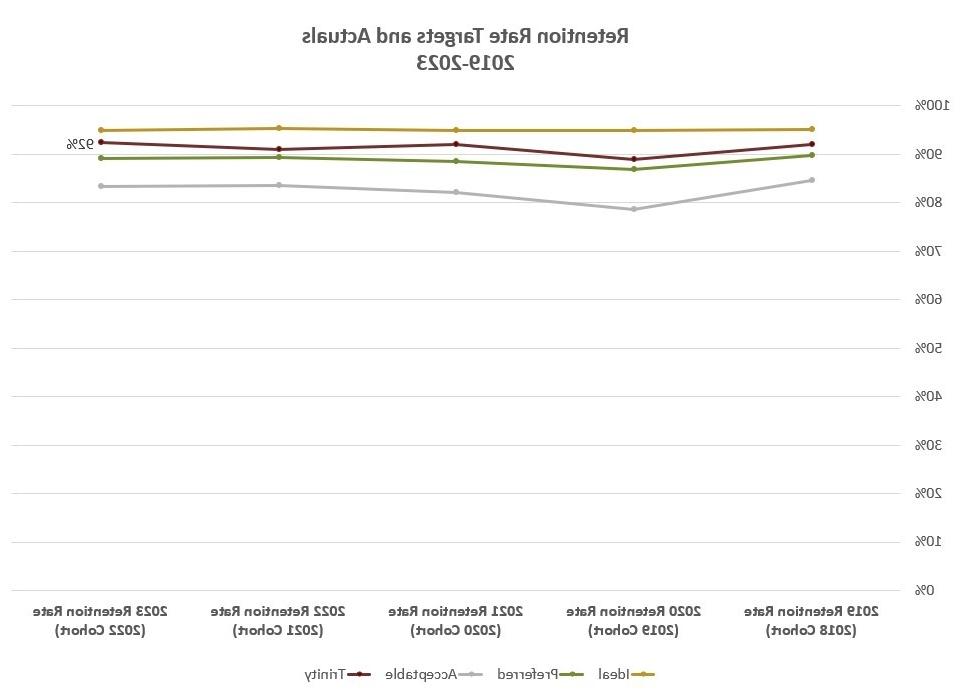
Figure 1: First to Second Year Retention Rate Targets and Actuals for First-Time Bachelor’s Degree-Seeking Undergraduates by Cohort Year
Graduation Rate
Trinity's Office of Institutional Research and Effectiveness has also identified acceptable, preferred, and ideal 6-year graduation rates. Using data from reference institutions, 6-year graduation rates are regressed on institutional characteristics. The resulting model is used to predict 6-year graduation rates at Trinity based on characteristics of each incoming cohort and characteristics of Trinity in the years each cohort was enrolled. The resulting prediction is Trinity's preferred 6-year graduation rate. The ideal and acceptable 6-year graduation rates are the upper and lower limits of the 95% prediction interval around each predicted 6-year graduation rate.
For the last five years, Trinity’s 6-year graduation rate has consistently exceeded the acceptable rate by 1-7 percentage points, ranging from 76% to 82% with an average of 79%. Using the most recently available cohort (2017), Trinity’s current 6-year graduation rate is 82%, which meets the preferred rate (see Figure 2).
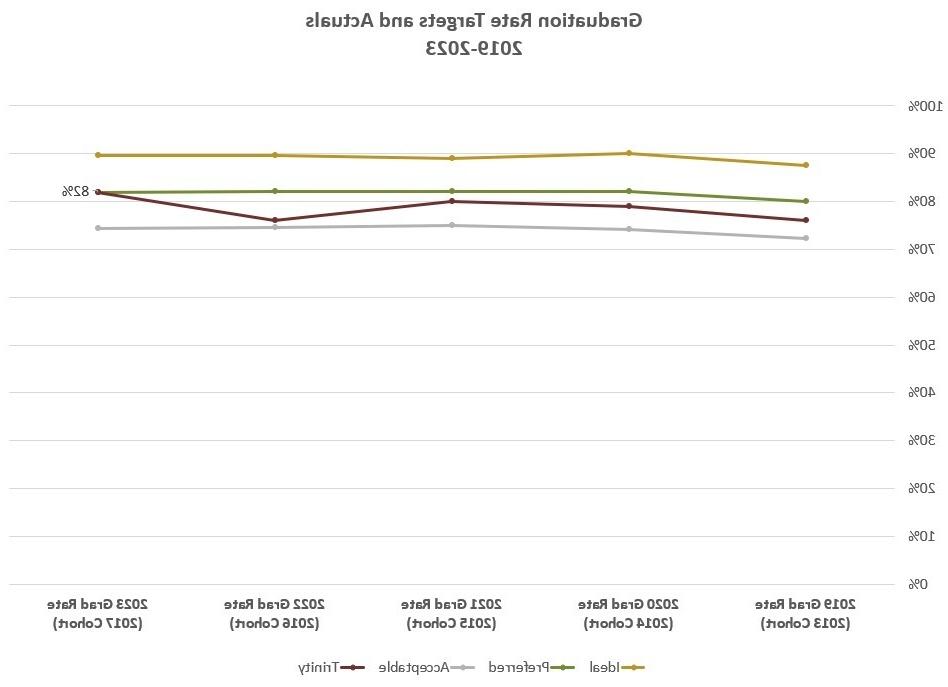
Figure 2: Bachelor’s Degree Graduation Rate Targets and Actuals for Full-Time, First-Time, Bachelor’s Degree-Seeking Undergraduates within 6 Years by Cohort Year
Career Outcomes
Trinity University participates annually in the National Association of Colleges and Employers (NACE) First-Destination Survey, which tracks the activities of college graduates within six months of graduation.
The First-Destination Survey provides a Career Outcomes rate, which represents the number of graduates who are employed, in volunteer or military service, or enrolled in further education divided by the number of graduates who are employed, in volunteer or military service, or enrolled in further education and those who are seeking employment or continuing education. In addition, the First-Destination Survey provides a Knowledge rate, which represents the percentage of graduates for whom an outcome is known.
Trinity has identified acceptable and preferred Career Outcome and Knowledge rates based on comparisons with other institutions. The preferred values represent the rates at institutions classified as “Baccalaureate Arts & Sciences” by the Carnegie Classification of Higher Education. The acceptable values represent the rates of all graduates who earned bachelor’s degrees regardless of institution type.
At this time, data is only available for three years of graduates (2020, 2021, and 2022). In all three years, Trinity’s Career Outcome rate has been higher than the acceptable rate, and for the last 2 years, Trinity’s rate has been above the preferred rate of 92%. For students who graduated in 2022, Trinity’s Career Outcome rate is 97% (see Figure 3).
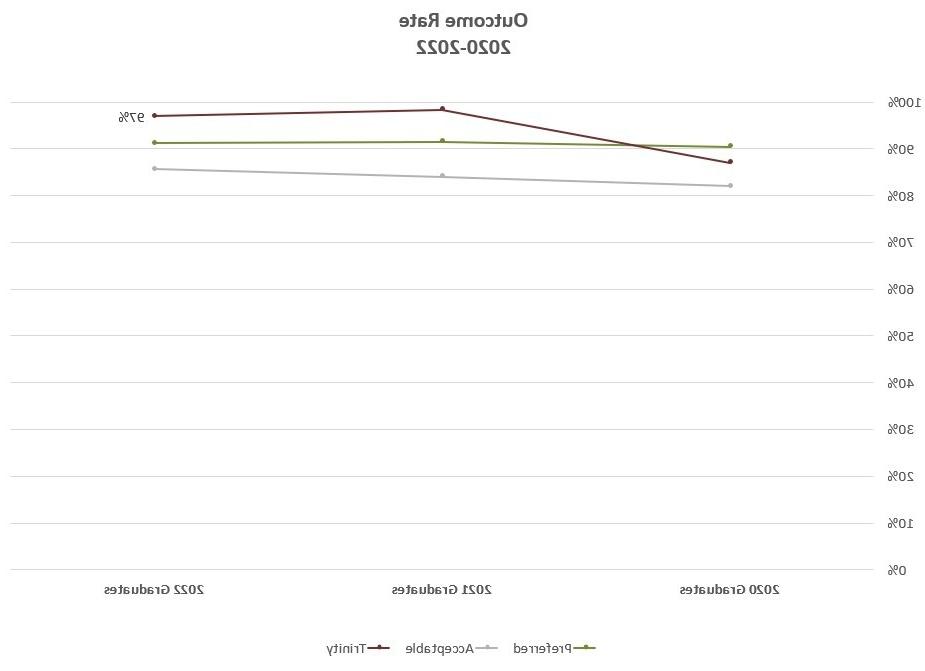
Figure 3: Career Outcome Rate Targets and Actuals by Graduation Year
Trinity’s Knowledge rate has been above the acceptable and the preferred rates in 2020-2022, with 81%, 79%, and 81% of graduates providing survey responses, respectively (see Figure 4).
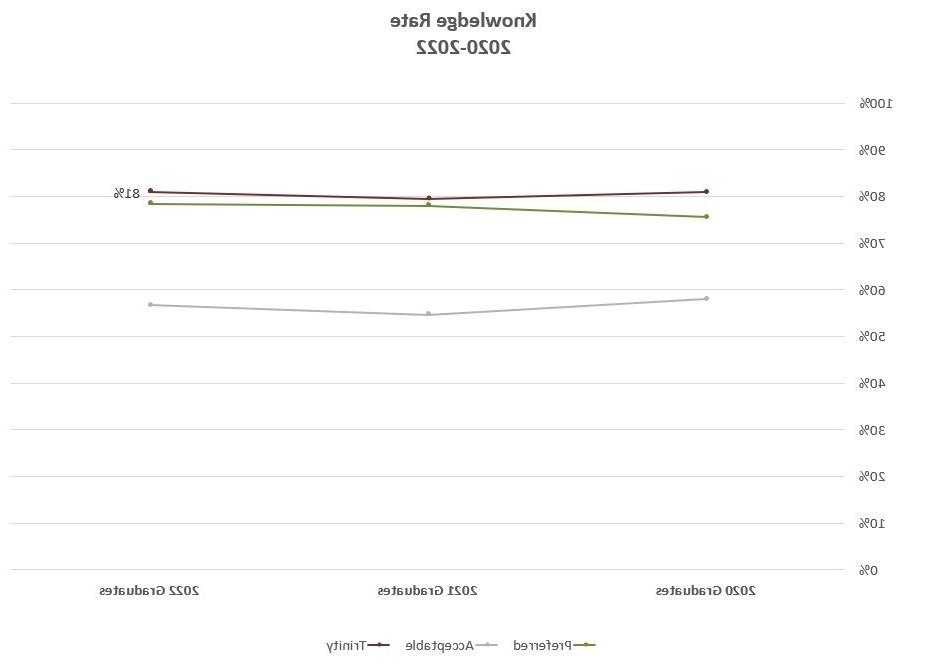
Figure 4: Knowledge Rate Targets and Actuals by Graduation Year
Graduate Student Success
Trinity University offers six masters-level graduate programs, one in Accounting, two in Health Care Administration, and three in Education. All of Trinity's graduate programs identify and evaluate goals and outcomes for multiple measures of student achievement, including time to degree, completion rates, and job placement or certification exam pass rates.
Time to Degree
Each graduate program has a target time to degree based on credit hours and degree requirements. Table 1 shows the target time to degree for each graduate program, the most recent graduating cohort, and the percent of each cohort that graduated in the target timeframe. For the most recent cohort, all programs except the Health Care Administration (Executive) program had 100% of graduates complete their degrees in the target timeframe. The Health Care Administration (Executive) program has historically had 100% of graduates complete within the target timeframe, except for the 2019 and 2020 cohorts, which were impacted by the pandemic because all students enrolled in the Executive program are full-time employees in the healthcare industry.
Table 1 - Time-To-Degree Targets and Actuals by Program
Program | Target Time | Most Recent | Percent |
|---|---|---|---|
| Accounting (M.S.) | 2 terms | 2022 | 100% |
| Health Care Administration (M.S.) | 28 months | 2020 | 100% |
| Health Care Administration - Executive (M.S.) | 23 months | 2020 | 78% |
| School Leadership (M.Ed.) | 4 terms | 2021 | 100% |
| School Psychology (M.A.) | 3 years | 2020 | 100% |
| Teaching (M.A.) | 3 terms | 2022 | 100% |
Completion Rate
Each graduate program has a target completion rate of 95%, except for the Master of Arts in Teaching, which has a target of 80%. This lower target reflects the program’s emphasis on vocational fit – when students are counseled into other roles in education or into related fields such as non-profits, counseling, or social work, that is considered a successful outcome. The Accounting, Health Care Administration, School Psychology, and Teaching programs all met their target completion rates. The Health Care Administration (Executive) program did not meet its target, but only one student did not complete, and prior to the pandemic, the program consistently had 100% completion rates. Similarly, the School Leadership program did not meet its target, but only two students did not complete, and the four cohorts prior to 2021 all met the 95% target (see Table 2).
Table 2 – Completion Rate Targets and Actuals by Program
Program | Target | Most Recent | Number in | Number | Completion |
|---|---|---|---|---|---|
| Accounting (M.S.) | 95% | 2022 | 26 | 26 | 100% |
| Health Care Administration (M.S.) | 95% | 2020 | 25 | 25 | 100% |
| Health Care Administration - Executive (M.S.) | 95% | 2020 | 10 | 9 | 90% |
| School Leadership (M.Ed.) | 95% | 2021 | 17 | 15 | 88% |
| School Psychology (M.A.) | 95% | 2020 | 10 | 10 | 100% |
| Teaching (M.A.) | 80% | 2022 | 16 | 14 | 88% |
Job Placement/Certification Exam Pass Rates
Each graduate program has a target job placement or certification exam pass rate. The School Psychology program and both Health Care Administration programs have a target job placement rate of 100% within 6 months of graduation and the Accounting program has a target job placement rate of 90% at graduation. For all four programs, the most recent cohorts to graduate had 100% job placement rates (see Table 3).
Table 3 – Job Placement Rate Targets and Actuals by Program
Program | Target | Most Recent | Job Placement |
|---|---|---|---|
| Accounting (M.S.) | 90% | 2022 | 100% |
| Health Care Administration (M.S.) | 100% | 2020 | 100% |
| Health Care Administration - Executive (M.S.) | 100% | 2020 | 100% |
| School Psychology (M.A.) | 100% | 2020 | 100% |
The School Leadership program has a target certification exam pass rate of 95% and the Teaching program has a target pass rate of 100%. In the most recent cohort of graduates, the Teaching program had a certification exam pass rate of 100% across both the Pedagogy and Professional Responsibilities (PPR) exam and content exams, whereas the School Leadership program had a 90% pass rate for the Principal as Instructional Leader (PAIL) exam and a 93% pass rate for the Performance Assessment for School Leaders (PASL) exam (see Table 4).
Table 4 – Certification Exam Pass Rate Targets and Actuals by Program
Program | Target | Most Recent | Outcome Rate |
|---|---|---|---|
| School Leadership (M.Ed.) | 95% | 2021 | PAIL Exam: 90% |
| Teaching (M.A.) | 100% | 2022 | PPR Exam: 100% |
Accreditation
Trinity University is accredited by the Southern Association of Colleges and Schools Commission on Colleges (SACSCOC) to award baccalaureate and master’s degrees. Trinity University also may offer credentials such as certificates and diplomas at approved degree levels. Questions about the accreditation of Trinity University may be directed in writing to the Southern Association of Colleges and Schools Commission on Colleges at 1866 Southern Lane, Decatur, GA 30033-4097, by calling (404) 679-4500, or by using information available on SACSCOC’s website (www.sacscoc.org).
Additional Accreditations
- Texas state teachers’ certificates are issued to those students who fulfill the requirements of the Texas Education Agency (TEA).
- Trinity’s school psychology program is approved with full national recognition by the National Association of School Psychologists (NASP).
- A chapter of Phi Beta Kappa is active on the Trinity campus.
- Trinity is approved and accredited by the U.S. Department of Education and the American Chemical Society.
- The Engineering Science (Bachelor of Science) program is accredited by the Engineering Accreditation Commission of ABET, http://www.abet.org, under the General Criteria and the Program Criteria for Engineering, General Engineering, Engineering Physics, Engineering Science and Similarly Named Engineering Programs.
- Trinity’s School of Business is accredited by the Association to Advance Collegiate Schools of Business (AACSB) for its undergraduate program in business administration.
- Trinity’s Health Care Administration Department is accredited by the Commission on Accreditation of Healthcare Management Education (CAHME) for its healthcare administration program.
Trinity is also a member of the Associated Colleges of the South, a consortium of sixteen distinguished liberal arts colleges and universities.
Resources
Data Den Guide
A step-by-step guide to logging into, exploring, and troubleshooting the Data Den system (Tableau).
Data Den
Our database and dashboarding system provides common data sets and reports.
Assessment Resources
We created an entire (secure) website to house our multitude of department- or topic-specific resources.
TU Survey Calendar
We maintain an updated calendar of active and upcoming surveys. To add your survey to the calendar, please contact Michelle Byrne
Reference Institutions

